SAP Business One Lumira – using SAP Business One reporting to tell the full story
10 Sep 2015 | by Brett MundellThe team at Leverage Technologies has spent some time evaluating SAP Lumira reporting for SAP Business One. Our view – outstanding……get SAP Business One Lumira to tell the full story in your business.
SAP Lumira Reporting for SAP Business One: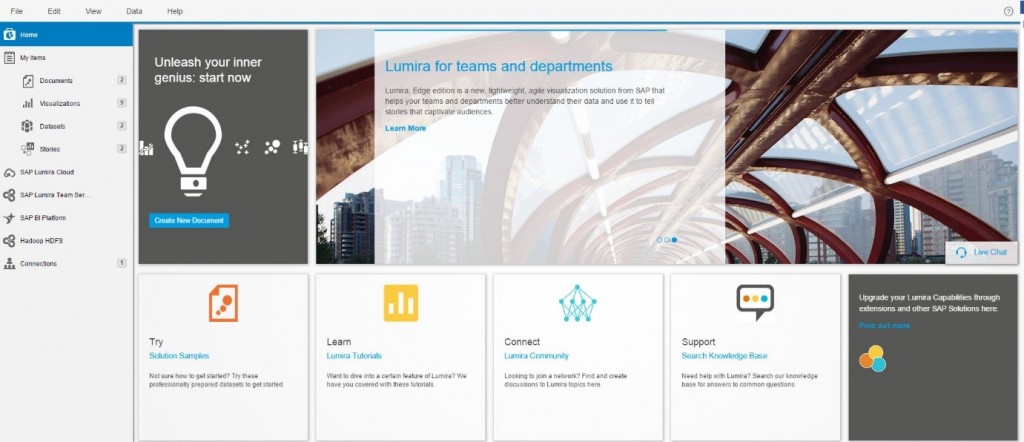 All SAP Business One customers have data – some have greater volumes of data than others. One thing is certain – SMEs are starting to build larger data volumes from multiple different sources – CRM, the web, mobility etc. The trick is sorting and analyzing data into meaningful analysis tools to help with decision making.
SAP talks about SAP Lumira being a self-service business intelligence tool and I think that assessment is correct. In many respects SAP Lumira answers the question I am often asked by SAP Business One customers – “can I create my own reports?”. The good news is that with SAP Business One Lumira you can.
Let’s assume you are about to walk into a management meeting. Some questions you might get asked include:
- Which are my most profitable customers, products and product lines?
- How did we go with budget Vs actual last month?
- How did last month’s sales compare with the same month last year?
- How did this quarter’s sales compare with the same quarter last year and the previous quarter?
The answers to these questions lies in your ERP data – the challenge is data extraction into meaningful reports – preferably graphical reports with drill down. Most people are not IT savvy and do not have days to prepare reports. The answer – self-service Business Intelligence form SAP Lumira.
The analytics dream:
- Graphical – a picture is worth a thousand words, people are more likely to retain graphical reporting images and knowledge;
- Get real time answers to your questions;
- Tell a story with your data.
Let’s take a look at some of the SAP Lumira features:
Prepare your data – SAP Business One Lumira is already integrated to SAP Business One. This makes data preparation easy. As you can see in the image below your data sets are already available and integrated from SAP Business One to SAP Lumira.
SAP Business One Lumira Reporting – step 1 – prepare your data: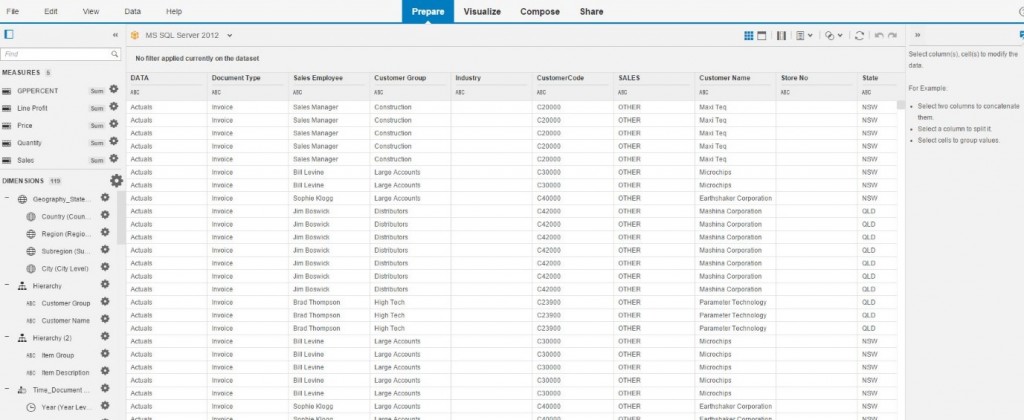
SAP Business One Lumira reporting – step 2 – visualize your data: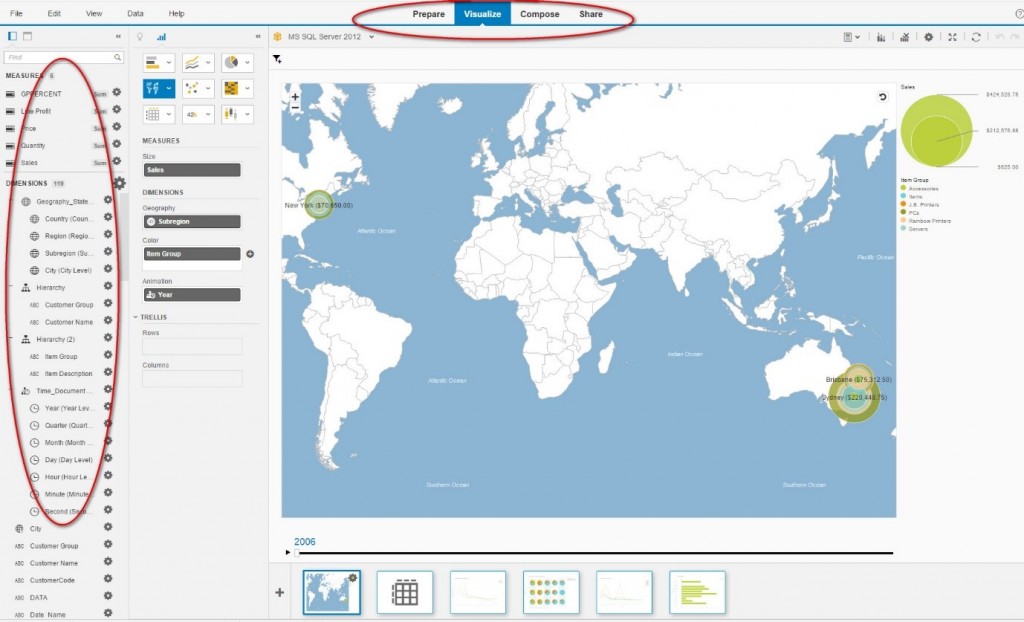
What measures and dimensions do you want? Drag in the relevant measures and dimensions. No technical skill set required.
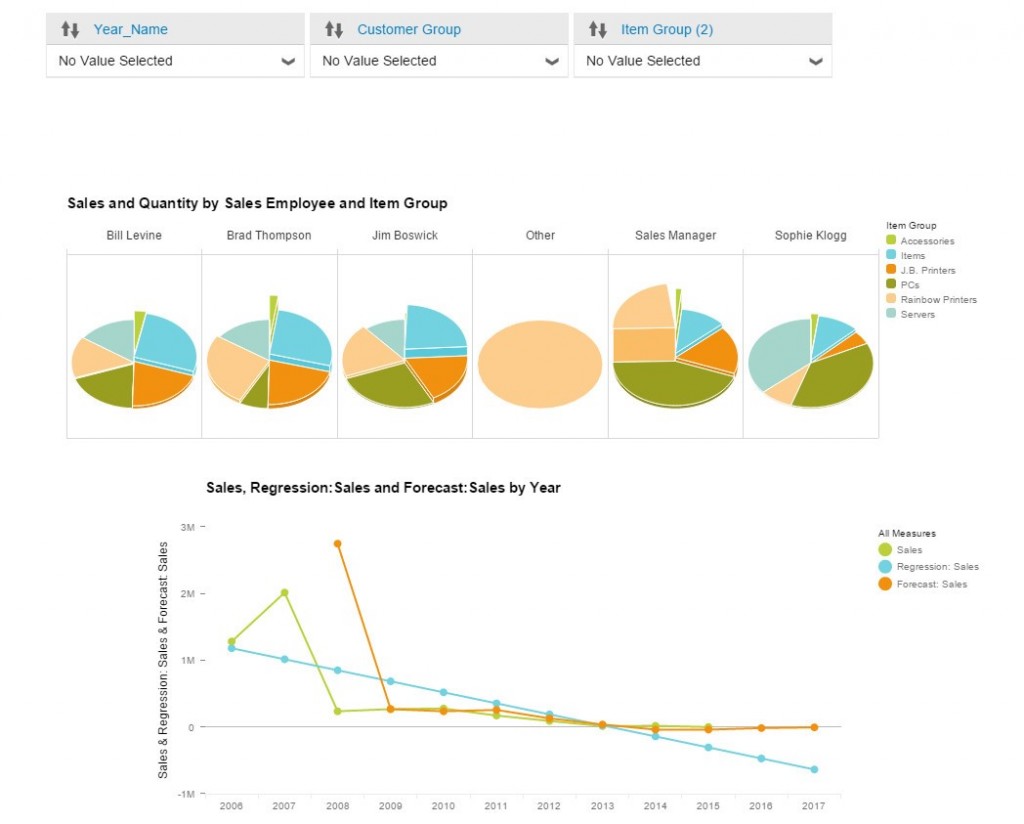
Compose your story. The next step in the reporting process is the most exciting. Compose your data in a storyboard. This step allows the user to combine multiple visual or table reports to tell a story. You might want to combine 4 different sales reports – by item, item group, GP and budget to tell the complete story.
SAP Business One Lumira reporting – Compose your storyboard:
Share – now that your story is complete share your story with team members by exporting the report, publishing the report to SAP HANA, publishing the report to explorer, using SAP Lumira cloud or SAP Lumira server.
Our summary – SAP Lumira reporting integrated to SAP Business One is:
- Low cost, high return;
- Easy to use;
- Does not require technical or IT skills;
- Users can create their own reports;
- Great visual representation.
Another great example of value add from the team at SAP.

Brett has more than 20 years of business software sales and company management experience. Brett has been involved in more than 300 ERP projects. His passion is customer satisfaction, making sure every client is more than just satisfied. Brett wants our customers to be driven to refer their friends and peers because we offer the best services and technology available and because we exceeded their expectations.





Leave a comment